
Height measurement & building monitoring
Annual altitude measurement
Even before the first caverns of the Etzel cavern facility were excavated in 1974, monitoring of the surface for changes in elevation began at the Etzel site in order to record the effects of cavern construction and operation on the surface.
In addition to the magnitude of the changes in elevation, the extent of the area of influence, which is limited by the zero subsidence line above which no change in elevation can be detected, is also of interest. For this purpose, a so-called precision leveling is carried out annually by an independent expert in a close-meshed fixed point network, which is coupled to the official measurement network of the national survey.
Height observation in the Etzel cavern field over time

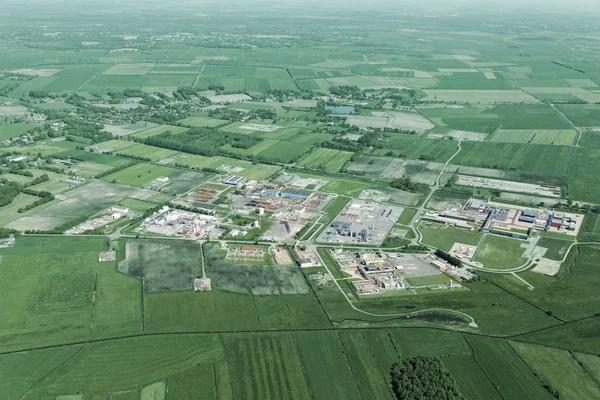
Cavern construction in Etzel, which began in 1971, causes subsidence at the surface, which forms a very shallow depression that is invisible to the naked eye. The subsidence depression has its deepest point in the center of the cavern field and runs flat outward.
Even before the first caverns were excavated, a network of numerous elevation control points was set up at the Etzel site in 1974 to monitor the effects of cavern construction and operation on the surface. For this purpose, height measurements (leveling) are carried out and evaluated annually by an independent expert. The network of elevation control points is connected to the official network of the state survey. The annual and total subsidence in the cavern field can be calculated, documented and graphically displayed by comparing the elevation measurements with previous years.
In order to exclude seasonal influences such as precipitation, temperatures, etc. to a large extent and to increase the informative value, the survey is always carried out in the same period of a year, if possible. In the following, the development of the subsidence representation in the past four decades is shown as an example.
Initially still analog representation of the subsidence
At the beginning of height monitoring in the 1970s and 1980s, the evaluation was still carried out analogously according to the state of the art at that time, i.e. the measurement results were documented on paper without computer technology using surveying instruments. The representation in the Risswerk (map series of the company) was still done with drawing pen and stencil.
Digital technology makes its way into height monitoring
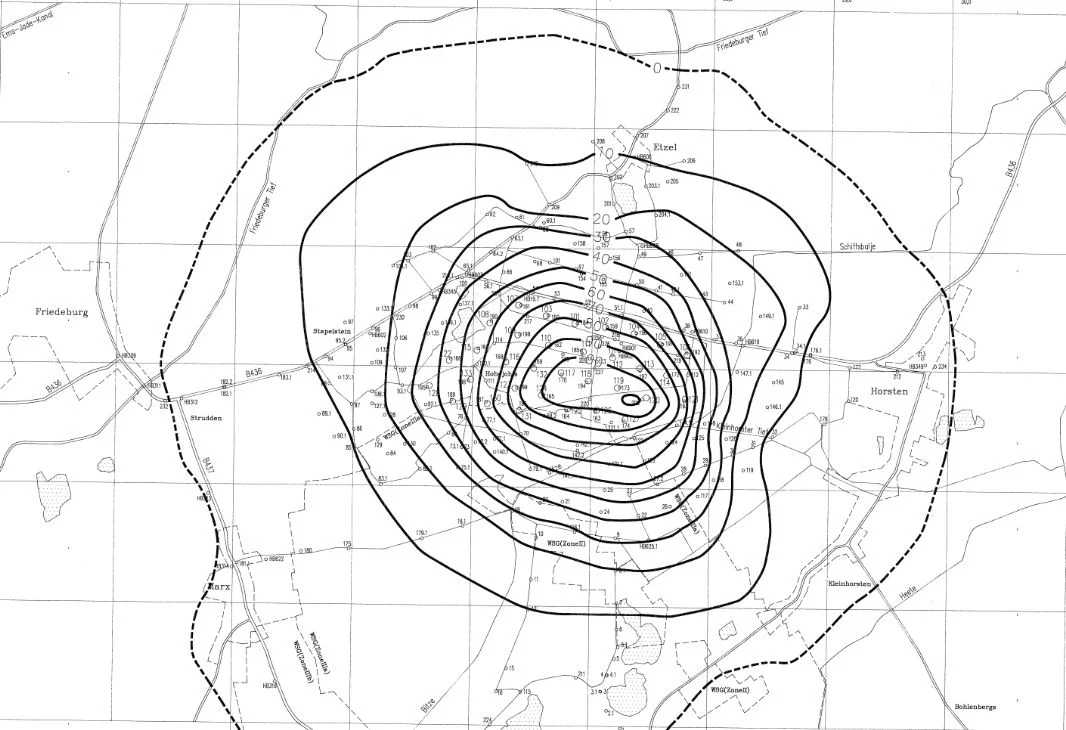
From the beginning of the 1990s, height monitoring could be carried out digitally. For example, the depiction of the subsidence flow with isocatabase lines (lines of equal subsidence on the surface of the day) could be created completely digitally on the computer with the help of surveying programs and also printed by means of the pen plotters, which were new at that time. Figure 1 shows the subsidence in 1991. The deepest point of the subsidence depression is located at height measurement point 220 in the cavern field south of federal highway 436.
The so-called zero line, the outermost line in the isocatabase plan, represents the boundary to the outer area unaffected by subsidence. It is located in the area of Friedeburg in the west and Horsten in the east (dashed line).
Expansion of the measurement network / progress in technology
With the advance of computer technology and digitization, it was possible to increase the accuracy of height measurement. In addition, the height network was continuously expanded due to the increasing number of new caverns. The number of height measurement points in the cavern field increased from just over 100 originally to over 800 today.
Due to the size of the field and the high number of fixed points, it happens that measuring points are lost or damaged over time due to external influences. For this reason, the measuring point network is regularly checked and, if necessary, supplemented by new or replacement points. Today's images in the Risswerk (map series of a mining operation) are created completely digitally. Colored background maps are state of the art today.
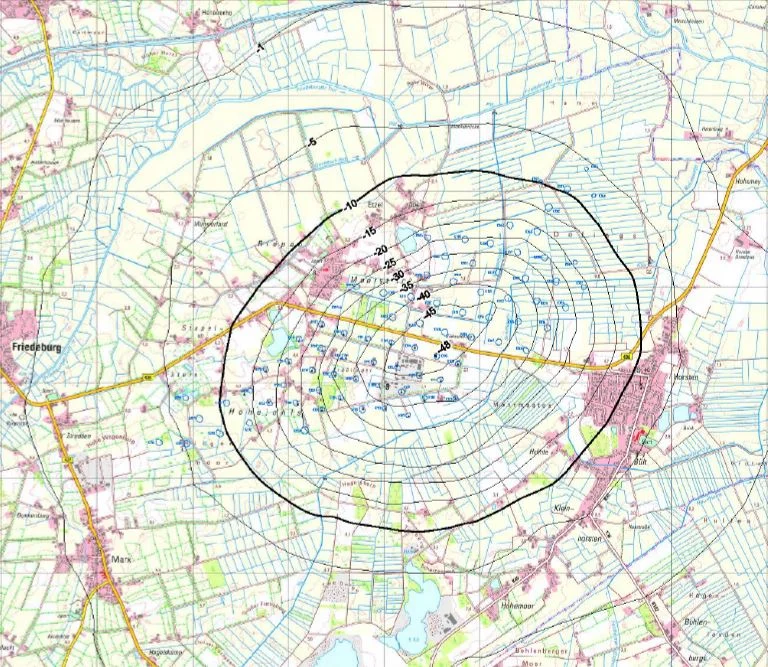
Figure 2 shows the dimensions of the subsidence trough in 2010, which have remained approximately the same as in 1991 (Fig. 1). Subsidence has continued to increase, with the lowest point in the center still at elevation point 220.
Center of subsidence trough migrates to north field
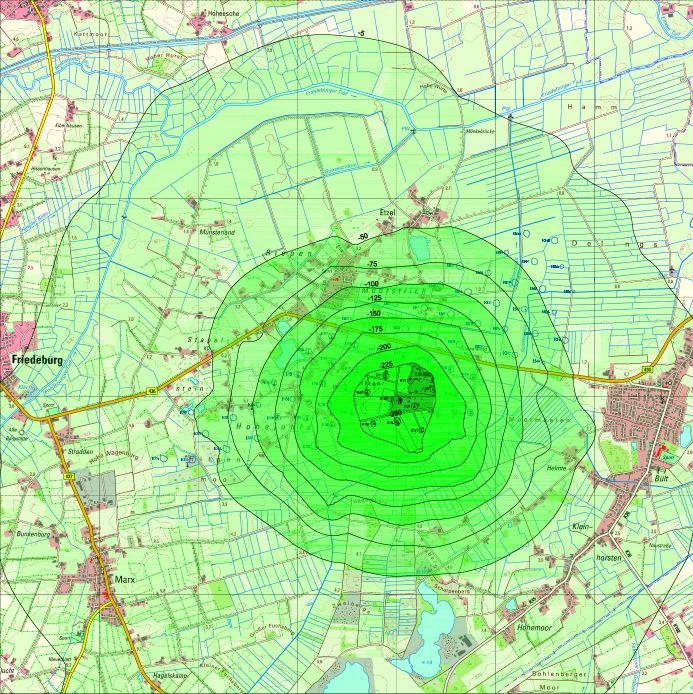
Figure 3 depicts subsidence as of 2017. The lowest point of the subsidence depression has now reached -48 cm and, in addition, the subsidence maximum has shifted several hundred meters to the northeast due to the influence of the new gas caverns.
Building monitoring

In 2015, STORAG ETZEL and the local citizens' initiative "Lebensqualität" had jointly agreed to initiate building monitoring as a confidence-building monitoring measure in the vicinity of the cavern facility for 36 properties with regard to possible subsidence damage and possible inclined positions.
51 building complexes monitored since 2018
Since 2015, a total of 51 building complexes with outbuildings, stables and garages have been monitored. The objects of observation are historical and public buildings, residential buildings and stables in the municipality of Friedeburg.
The respective initial measurements in the actual state are carried out by recognised experts. The respective observation objects are only approved after consultation with the owners. Afterwards, the building is surveyed with height bolts and then a zero measurement is carried out by a recognised expert.
Surveys and measurements are carried out every 5 years
Every 5 years, the buildings are also surveyed by an expert in order to detect any subsidence effects at an early stage. This monitoring procedure complies with the mining damage assessment and surveying processes recognised in Germany.
The buildings in question were surveyed at the respective time intervals in connection with the height observation (levelling) of the cavern field for possible inclinations. After consultation with the citizens' initiative, the measurement intervals were combined to 5 years in accordance with the provisions of the STORAG ETZEL framework operating plan of 2020.
Further objects will be included
The approval of the STORAG ETZEL general operating plan provides for the successive inclusion of further monitoring objects in the monitoring programme for buildings. The objects are specified by the responsible mining authority in the approval procedure for the general operating plan.
The survey overview of the building monitoring program can be viewed here: